- XRP faces increasing bearish sentiment from macro, micro, and fundamental factors in April.
- Weak on-chain indicators ranging from network growth, total supply, and active addresses reinforce an impending crash.
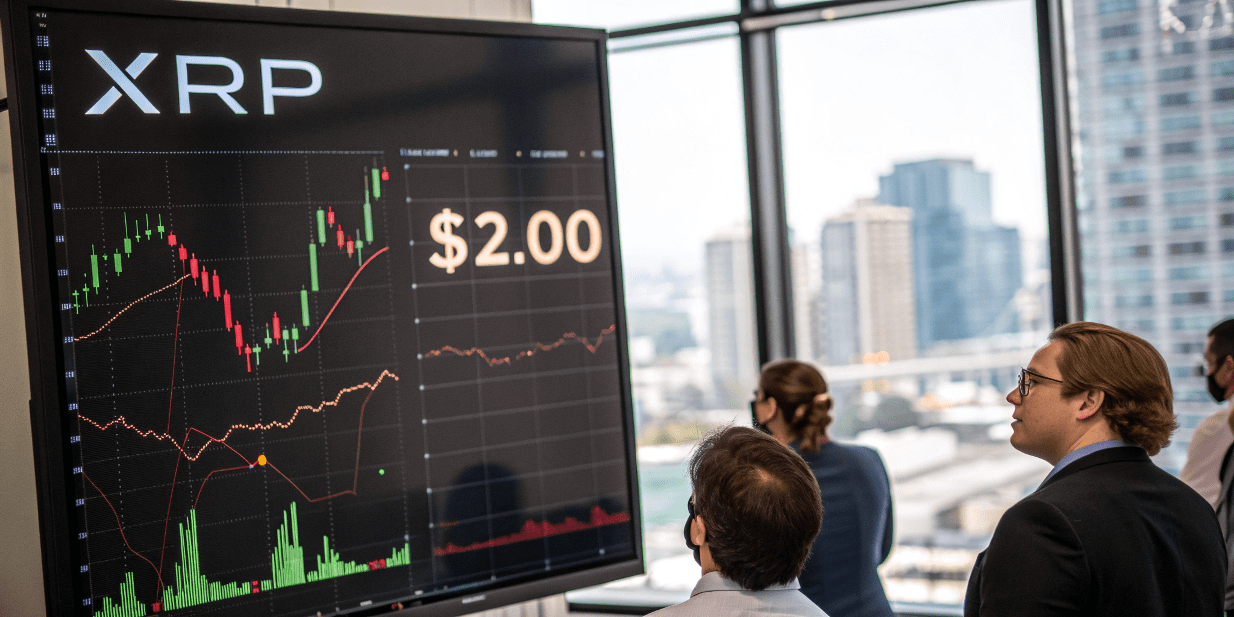
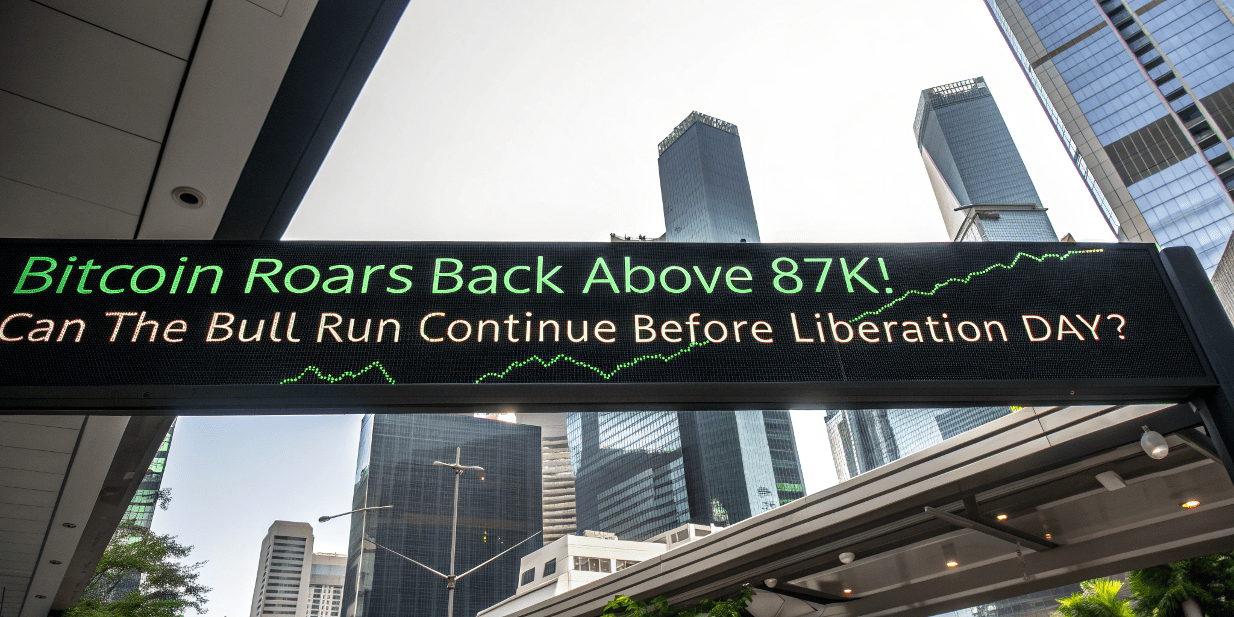
- A descending triangle pattern puts $2 support in focus as global markets battle Donald Trump’s tariff uncertainty.
- XRP could rebound from the 200-day EMA, increasing the chances of reclaiming the mid-term $2.5 target.
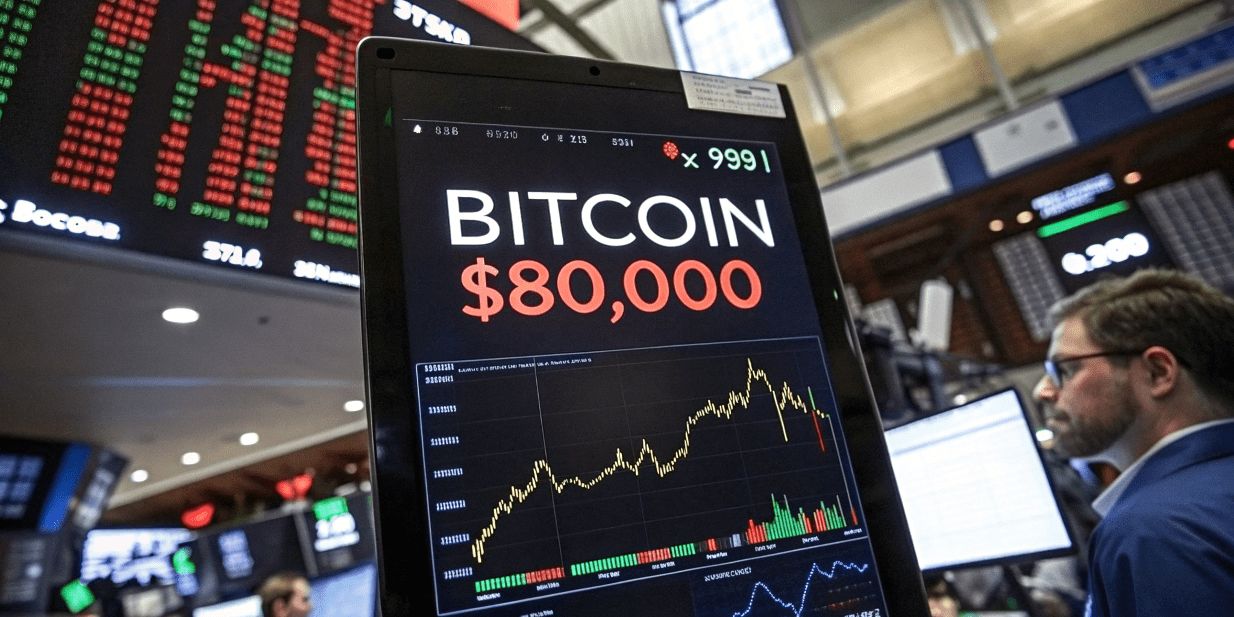
Ripple’s XRP is facing significant downward pressure, with a confluence of bearish technical indicators and weakening on-chain metrics suggesting a potential 68% price crash to $0.62. The cross-border payments token is currently trading near $2.04, a slight recovery after a 5.38% dip on Wednesday, as global markets grapple with the implications of US President Donald Trump’s newly enacted reciprocal tariffs.
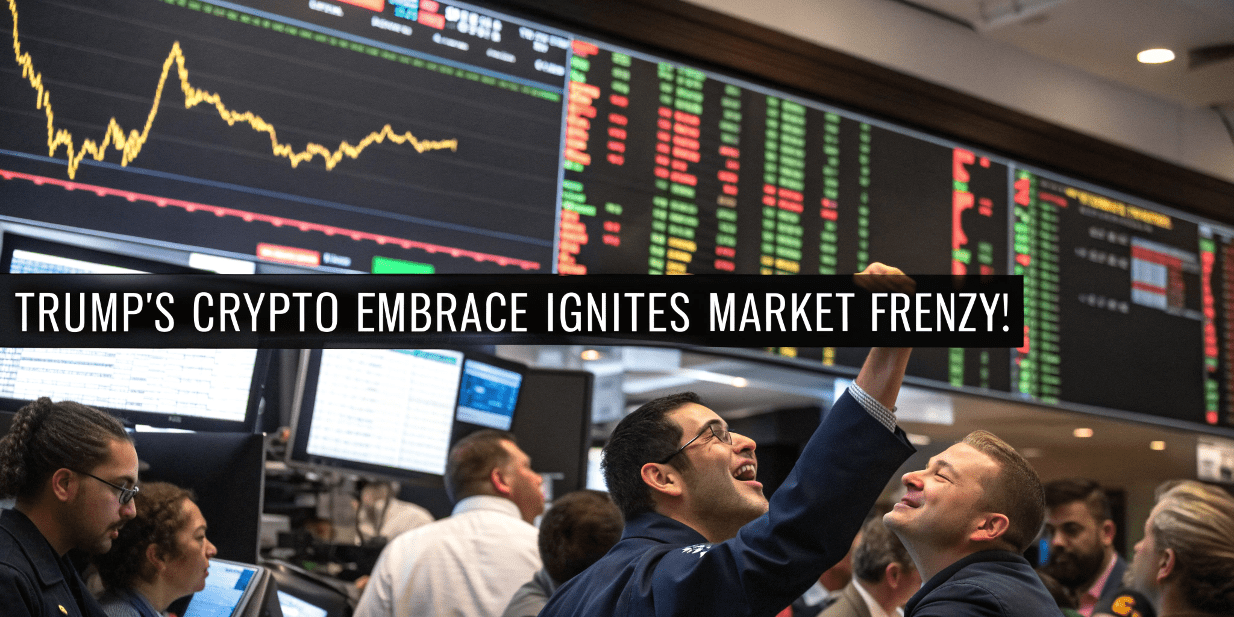
While the market appeared to have initially priced in the tariffs, dubbed “Liberation Day” by the former president, major cryptocurrencies, including Bitcoin, Ethereum, and XRP, are struggling to maintain crucial support levels. This uncertainty, coupled with concerning on-chain data, has fueled fears of a deeper correction for XRP.
Trump’s Tariffs Spark Market Jitters and XRP Liquidations
Trump’s sweeping tariffs, imposing a baseline 10% charge on goods imported to the US, have triggered a wave of unease across global markets. While some countries will face reduced tariffs, the overall impact has led to a 3% decline in the total cryptocurrency market capitalization, which now stands at $2.77 trillion.
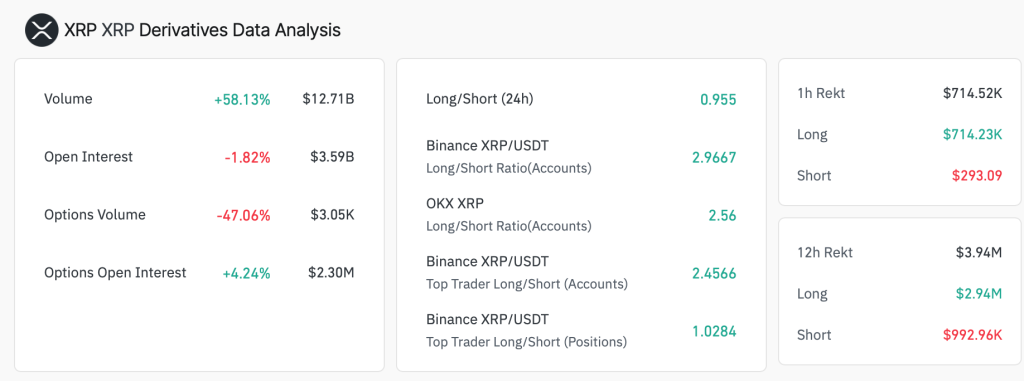
The volatility has also impacted XRP traders, with Coinglass data revealing $3.94 million in liquidations over the past 24 hours. A significant $2.94 million of this was attributed to the forced closure of long positions, highlighting the prevailing bearish sentiment.
On-Chain Data Paints a Bleak Picture for XRP
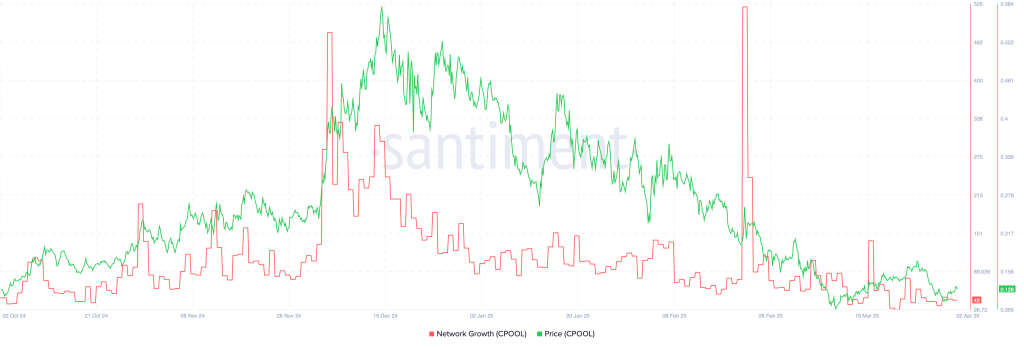
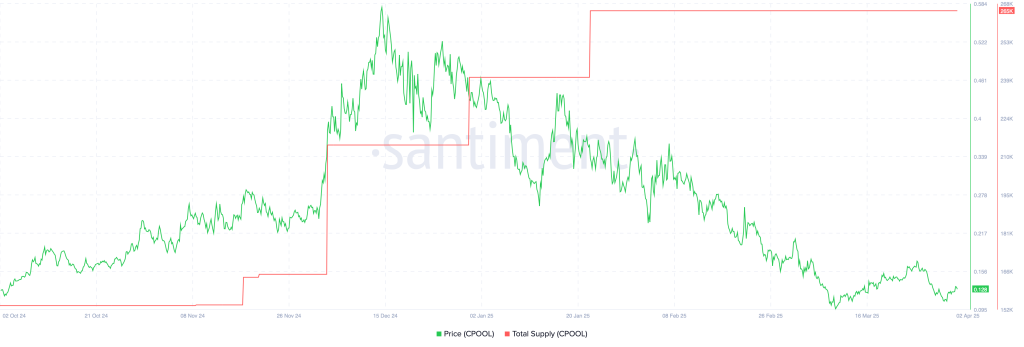
Several key on-chain indicators for XRP are flashing red, reinforcing the potential for further price declines. Data from Santiment reveals a sharp downward trend in Network Growth, a metric reflecting the number of new addresses joining the XRP network. This figure has plummeted from a high of 514 in February to just 42 on Thursday, indicating a significant decrease in user adoption and interest.
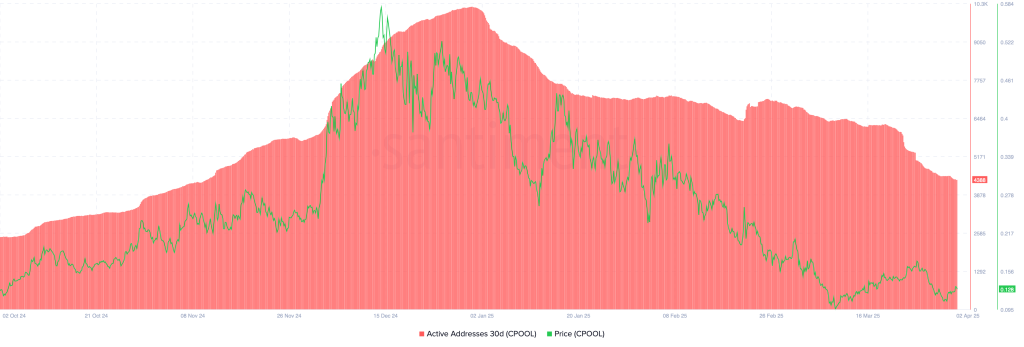
Similarly, the number of active addresses on the XRP network has seen a substantial decline, falling from a peak of 10,200 in January to the current 4,388. This sustained decrease in transactional activity suggests a growing risk-off sentiment among XRP holders.
Adding to the concerns is the significant increase in the total supply of XRP, as reported by Santiment. This continuous release of tokens from Ripple’s escrow account has long been a point of contention within the crypto community, with some labeling it as a form of “dumping.” The data indicates a correlation between the rising supply and the declining value of XRP.
Descending Triangle Signals Potential 68% Plunge
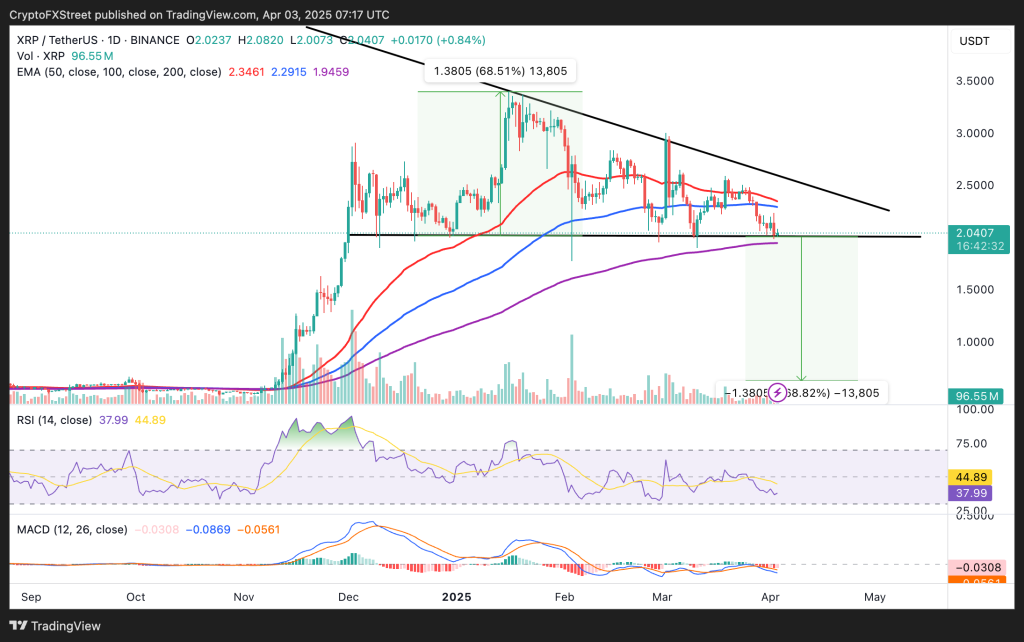
From a technical analysis perspective, XRP’s price action is forming a bearish descending triangle pattern on the daily chart. This pattern is often interpreted as a precursor to a significant price drop. If the immediate support level at $2 breaks down, the pattern projects a potential 68% decline to approximately $0.62.
Further reinforcing the bearish outlook are technical indicators like the Moving Average Convergence Divergence (MACD) and the Relative Strength Index (RSI). The RSI currently sits at 38 and could soon enter oversold territory, while a bearish divergence in the MACD suggests that traders are increasingly favoring short positions.
Potential Rebound Scenarios Exist
Despite the overwhelming bearish signals, there are potential scenarios that could invalidate the downtrend. The 200-day Exponential Moving Average (EMA) currently sits at $1.93 and could act as a strong support level, potentially triggering a rebound.
For a recovery to gain traction, bulls need to hold the $2 support level. Additionally, the RSI would need to climb above 50, and the MACD would need to generate a buy signal with its histograms turning green. If these conditions are met, XRP could potentially target $2.50 in the mid-term and $3.00 in the long-term.
However, the current market sentiment and the strength of the bearish technicals suggest that XRP faces a challenging path ahead, with the $2 support level being a critical point to watch in the coming days.